In this article, we’ll show you how to configure monitoring of a standalone VMware ESXi host with Zabbix. On ESXi, you cannot install zabbix-agent to enable classic monitoring. However, Zabbix can use SOAP (Simple Object Access Protocol) to communicate with ESXi using XML-RPC format messages.
There are several options available in Zabbix for VMware ESXi:
# cat /etc/zabbix/zabbix_server.conf | grep VMware- StartVMwareCollectors =3
- VMwareFrequency = 60
- VMwarePerfFrequency = 60
- VMwareCacheSize = 32M
- VMwareTimeout=120
Enable these options and restart Zabbix:
# systemctl restart zabbix-server.serviceCheck that VMware support is now enabled in Zabbix:
# cat /var/log/zabbix/zabbix_server.log | grep vmwareVMware monitoring: YES
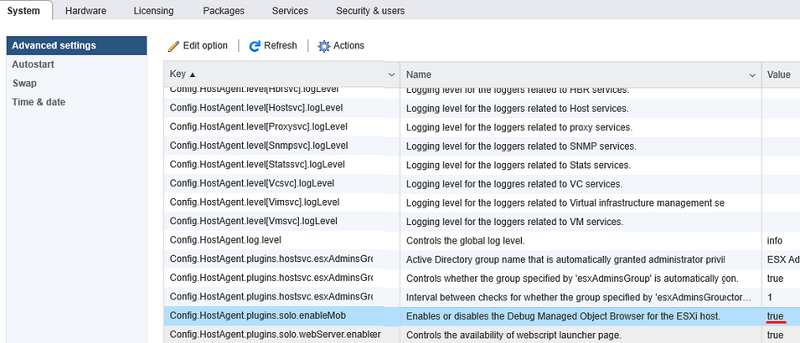
Get the UUID of your ESXi host. To do this, in the advanced settings of the ESXi host, enable the option Config.HostAgent.plugins.solo.enableMob = True (Enables or disables the Debug Managed Object Browser for the ESXi host)

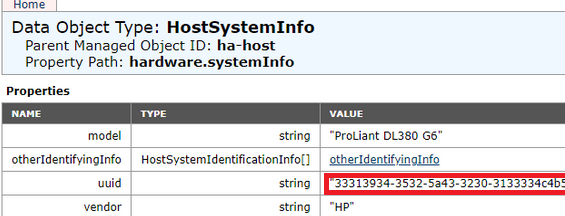
Go to web page https://your_esxi_host/mob/?moid=ha-host&doPath=hardware.systemInfo
Copy the UUID value.

Or, to get the UUID, you can connect to ESXi using SSH and run the command:
vim-cmd hostsvc/hostsummary | grep uuidNow download the zabbix template for VMware ESXi (TEMPLATE – VMWARE – STANDALONE ESXI HOST.xml) and import it Configuration -> Templates -> Import.

Now you can add an ESXi host to Zabbix. Specify UUID as hostname, specify the host IP address, select Zabbix template.
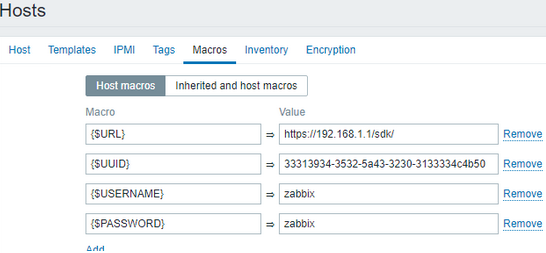
On the Macros tab, fill in the fields:
{$URL} = https://ESXI_SERVER_IP/sdk/

{$UUID} = set your UUID

{$USERNAME} = ESXi zabbix user Login

{$PASSWORD} = ESxi zabbix user Password

Go to Monitoring -> Latest data tab. After 10-15 minutes, metrics from your ESXi host should appear here.
